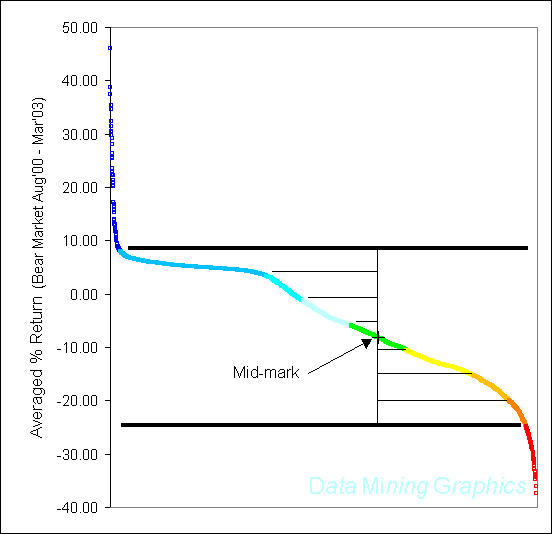
Location of the mid-mark and delineation of the color scheme.
The plot is averaged returns (Bear market Sep'00 - Mar'03) vs sorted order. The highest and lowest group of averaged returns are ignored (dark blue and red). The mid-mark is the middle value of the remaining range. This range is divided into 7 equal intervals, and each interval assigned a color. Notice that the number of funds in each colored band is different. Since each metric would have a different shape, the number of funds in the colored bands would also be different. What is constant, is the average difference in the value of the metric between the middle 5 adjacent colored bands. In this example, that average difference is 7.1%See our Past Data Bits page for similar plots of other metrics.
